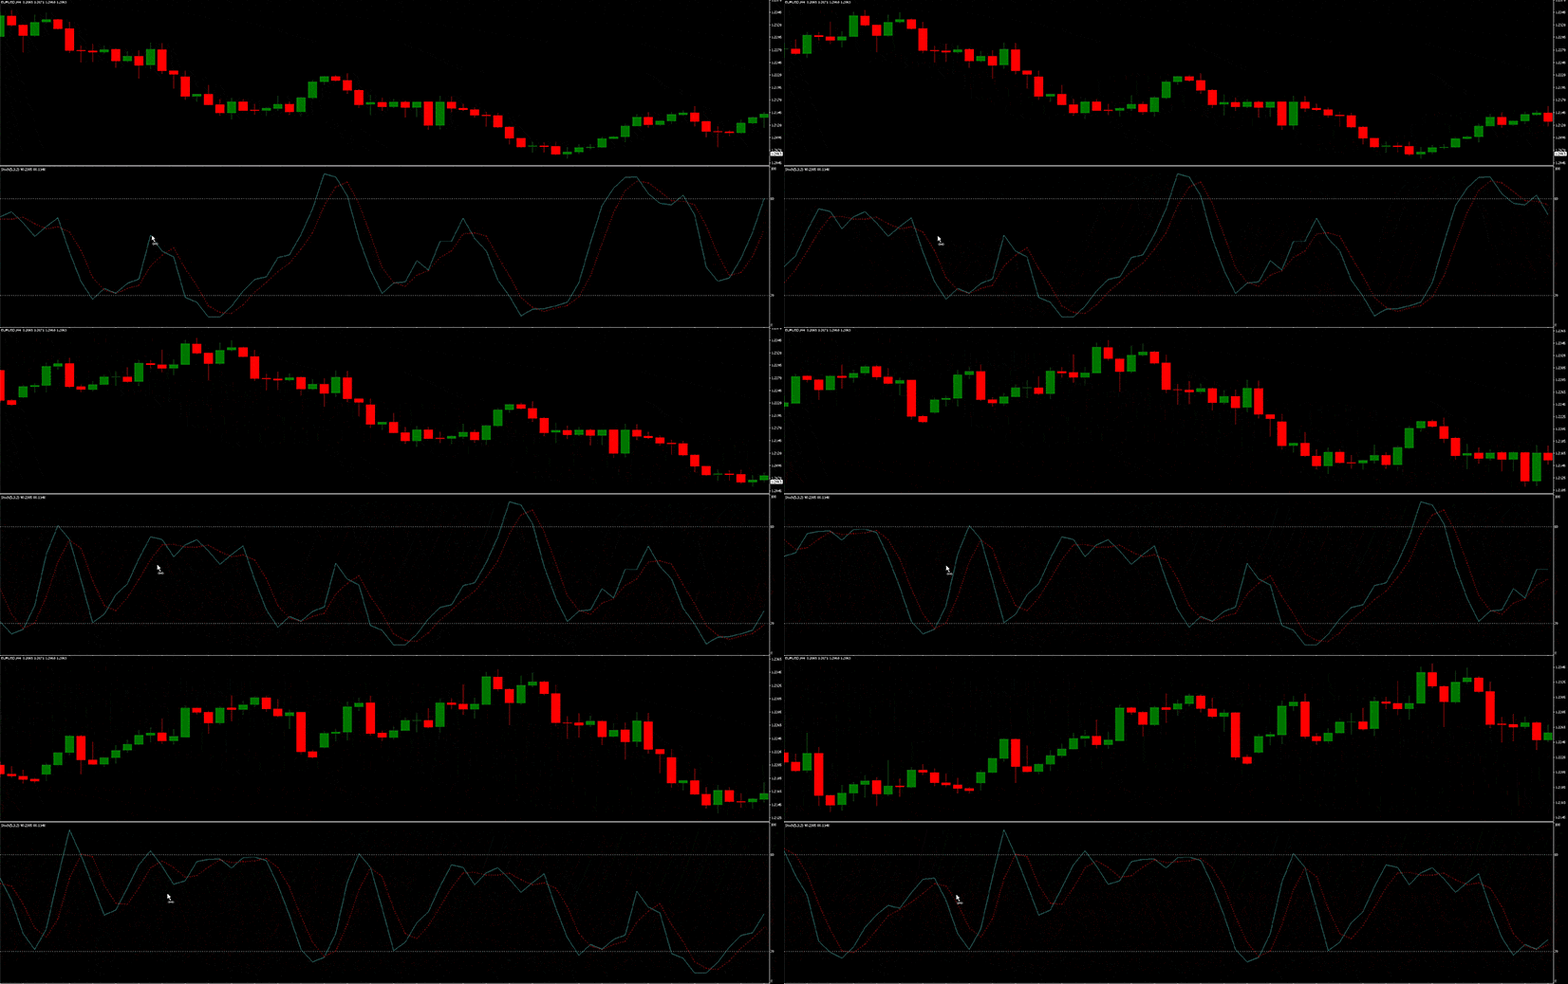
🌎 The Stochastic Oscillator: How does it work?
And a strategy on how to trade with it!

Hello traders! 📈
Ever feel like you're chasing a price that's already running away?
The Stochastic Oscillator can help you catch those elusive momentum shifts.
Today, we're diving into this versatile indicator, giving you the tools to identify potential overbought and oversold conditions and spot those crucial shifts in price momentum.
Remember those times you felt a price was about to reverse?
The Stochastic Oscillator measures the closing price against its recent range, highlighting when an asset is near its highs or lows.
This indicator uses two lines: %K, which measures the closing price relative to the recent range, and %D, a smoothed version of %K. A cross above %D suggests a bullish trend, while a cross below indicates a bearish one.

Look for overbought and oversold signals.
Readings above 80 suggest a potential reversal downward, while readings below 20 suggest a potential rebound upward.
❗️ Reflect on your recent trades.
Did you ever feel like a price was too high or too low?
How could the Stochastic Oscillator have helped you identify those situations?
Experiment with the Stochastic Oscillator on your favorite charts.
Observe how it reacts to price movements and whether it helps you identify potential turning points.
Integrating the Stochastic Oscillator into your trading strategy can be a good move.
If you want to, we got you covered; we are sharing a free PDF guide with a strategy to trade with this indicator.
To Your Trading Success,
Casey Stubbs
If you want to get some additional training from me and love books, here is a review I just got from my book.

You might want to check it out.
