ETH/USD Weekly Chart Analysis

Ethereum (ETH/USD) weekly chart.
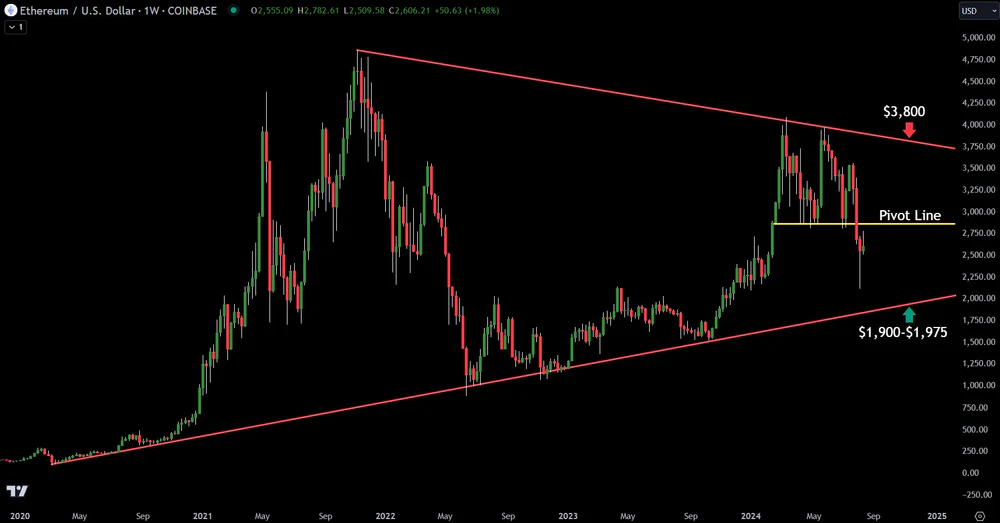
As depicted in the attached chart, Ethereum is currently trading within a symmetrical triangle pattern, a formation it's been following since 2021.
The key levels to watch include the pivot line around $2,750, which currently acts as a critical resistance level.
Upside Target:
- If Ethereum breaks above this pivot line, the next significant resistance is near the $3,800 level. This area could offer a potential upside target if bullish momentum resumes.
Downside Target:
- On the downside, if Ethereum fails to hold the $2,750 level, we might see a retest of the lower boundary of the triangle, with support expected in the $1,900-$1,975 range.
- This support zone will be crucial to monitor for any potential reversal or further decline.
Overall, this symmetrical triangle pattern suggests that a breakout is likely in the near term.
We should closely monitor price action around these key levels for any trading opportunities.
💡
Election Year Big Opportunity: Learn The Way Here:
To Your Trading Success,
Casey Stubbs
💡
Get my book to learn the exact methods I trade. The Complete Trading System
