No indicators? No Problem!

Indicators are not needed to be a kick butt trader.
I'm going to show you exactly what I need to make money.
Day in and Day Out.
I call this the sweet spot.
Trade in the sweet spot and you will be the best of the best in the world.
Trade out of the sweet spot and you will be a perpetual loser.
Discovering Support Levels with Candle Patterns
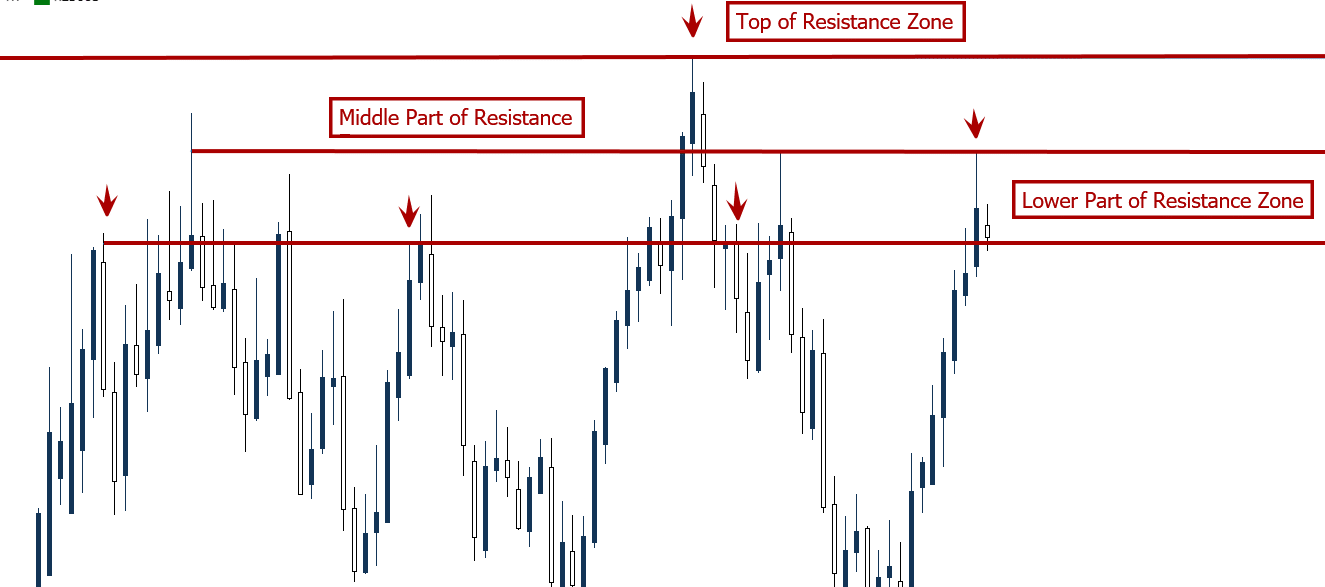
To find the sweet spot you need Support levels which are crucial for traders as they indicate where the price tends to stop falling and may reverse.
Here's a straightforward method to find these levels
Identify Key Price Zones: Start by observing areas where the price has historically bounced back. These are potential support zones.
Look for areas where the price touches the same level multiple times.
Spot the Right Candle Patterns: Once you've identified a potential support zone, look for specific candle patterns that signal a reversal. Some of the most reliable patterns include:
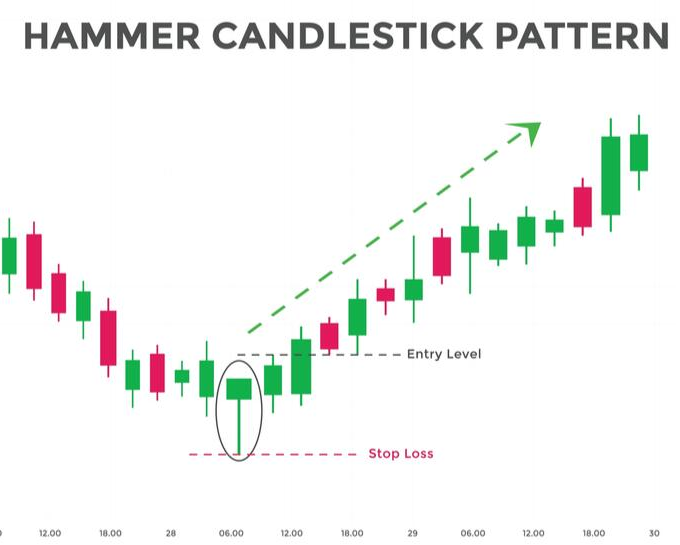
- Hammer: This pattern features a small body and a long lower wick, indicating that sellers pushed the price down but buyers stepped in to push it back up.
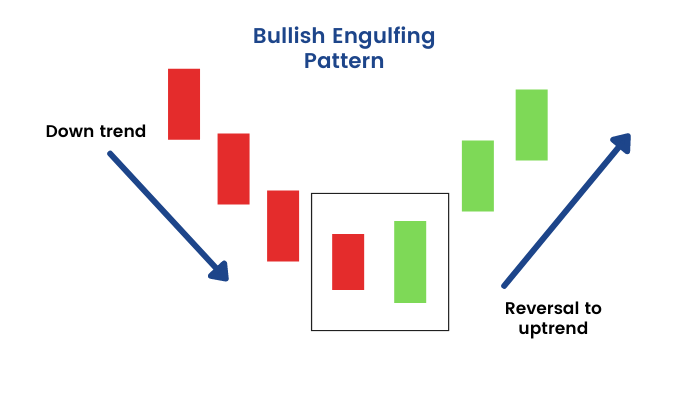
- Bullish Engulfing: This occurs when a small bearish candle is followed by a larger bullish candle, engulfing the previous one. It suggests a strong reversal.
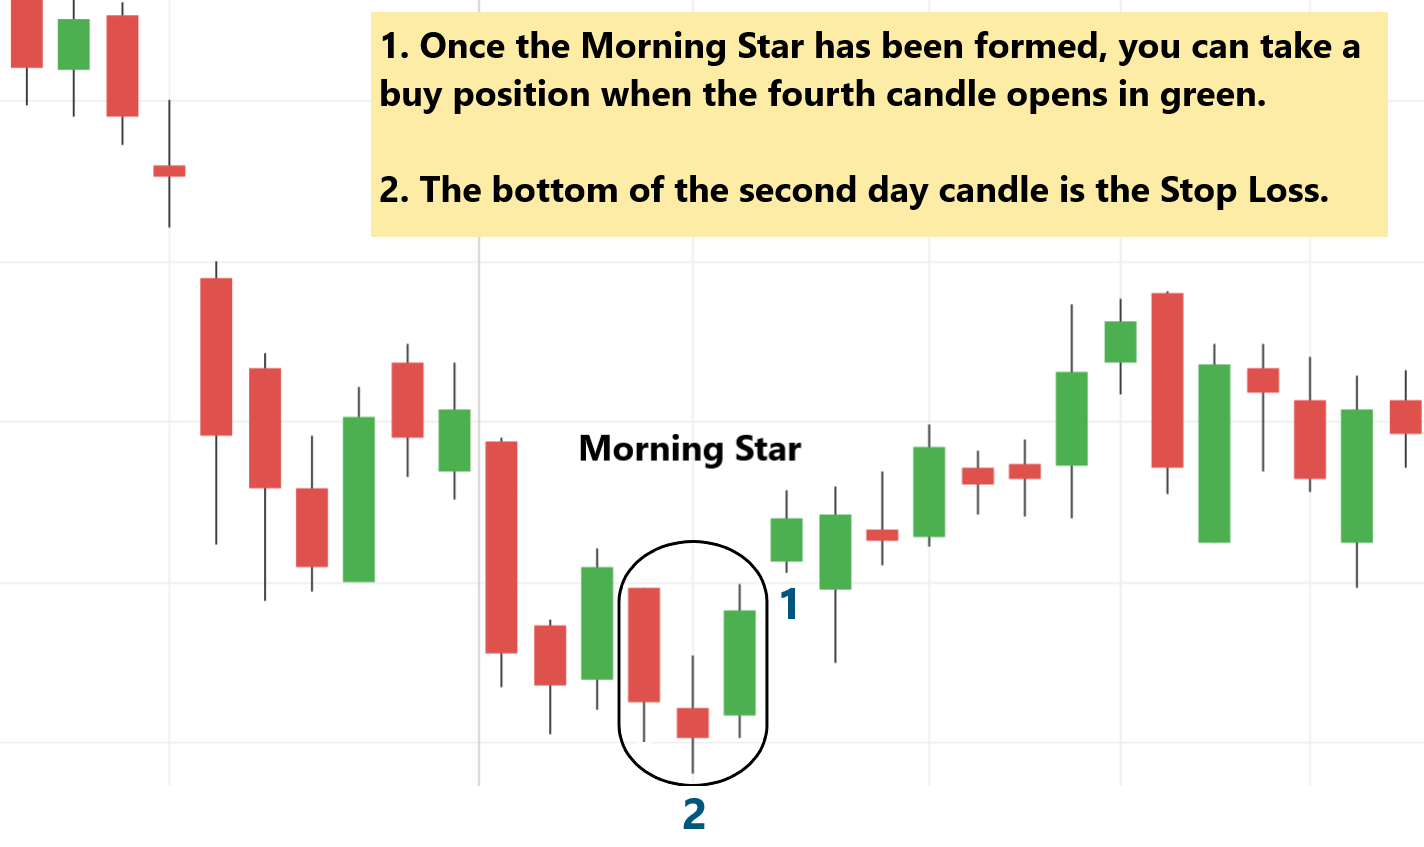
Morning Star: A three-candle pattern where a long bearish candle is followed by a small-bodied candle and then a long bullish candle, indicating a bullish reversal.
Ready to take your trading skills to the next level?
We’re offering a Free Sweet Spot Seminar. Listen we hit three out of three trades last week when the market got destroyed.
Its not because of anything else but the sweets spot and we will show you exactly how.
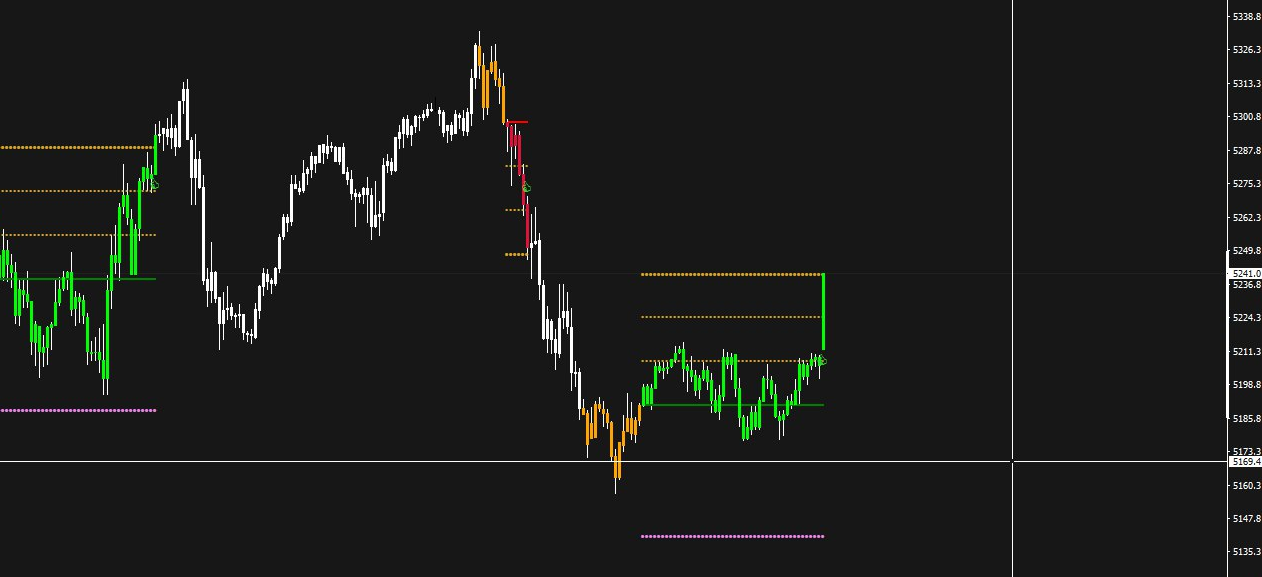
Here is the last trade that we nailed that made us a nice $940 profit in just a few hours.
To Your Trading Success,
Casey Stubbs
