Bullish Bullish Bullish!

I am bullish right now and of course I'm going to give you all the reasons why based on my charts.
💡
Don't miss out—reserve your spot now for the live training! Learn The Way Here:
Trend and Support/Resistance:
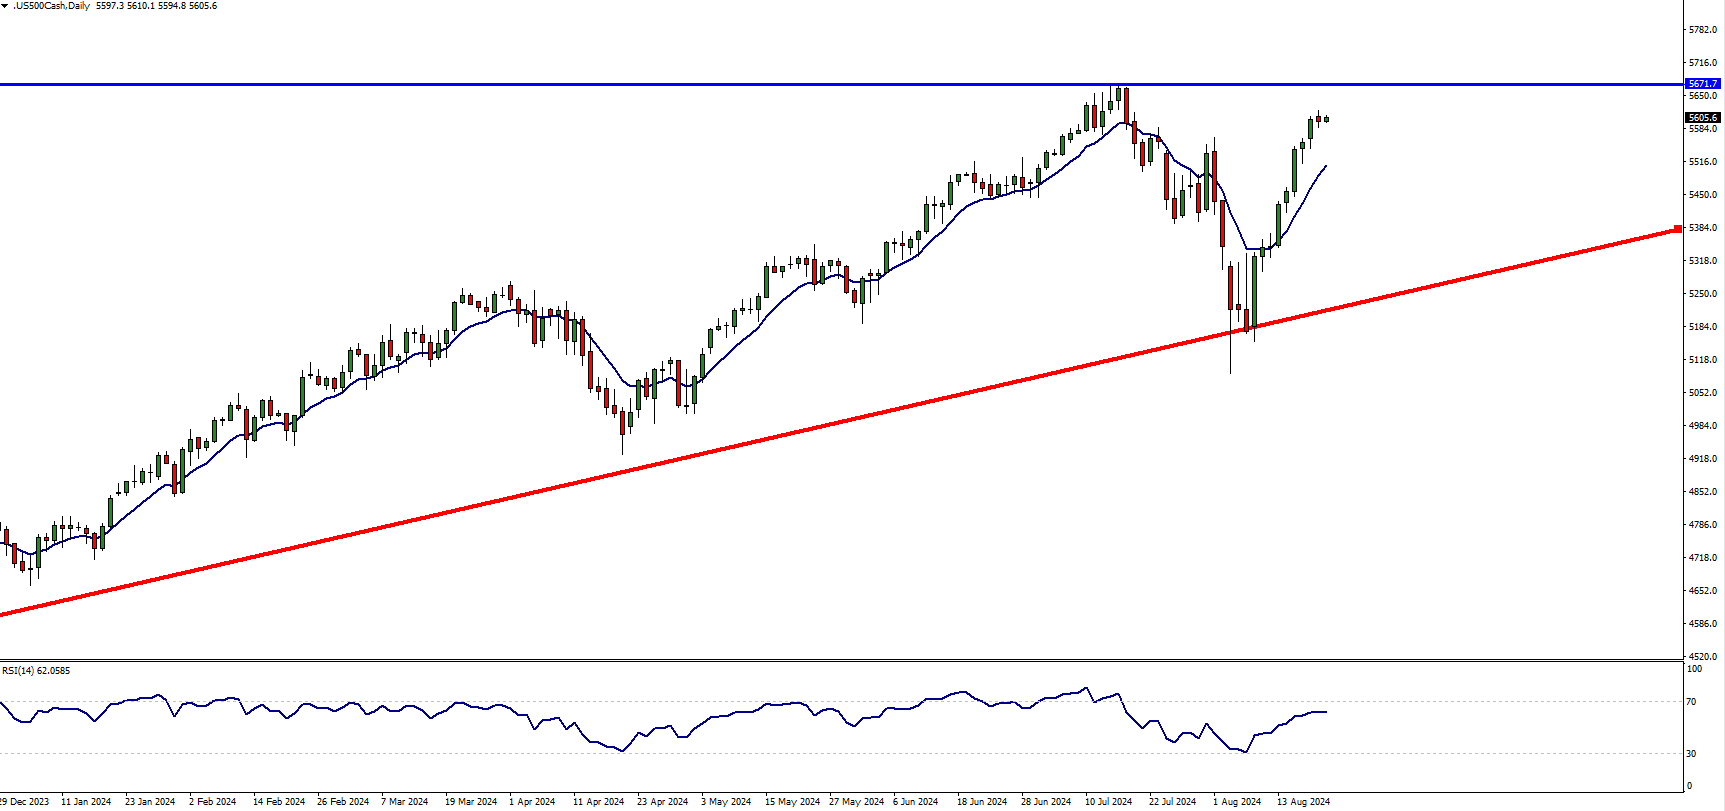
- Uptrend: The S&P 500 is in an overall uptrend, as indicated by the series of higher highs and higher lows. The red ascending trendline shows a strong long-term support level that the price has respected multiple times.
- Resistance Level: The blue line at 5671.7 represents a key resistance level. The price is currently approaching this resistance, indicating potential difficulty in moving higher unless strong buying pressure continues.
- Current Position: The price is near the recent highs after a recovery from a pullback in June and July 2024.
Moving Averages:
- Short-Term Momentum: The blue line, likely a short-term moving average (e.g., 20-day), is currently acting as dynamic support, indicating that the short-term trend is bullish.
RSI (Relative Strength Index):
- RSI Level: The RSI is at 62.19, which is below the overbought threshold (70). This suggests that there is still room for the index to move higher before hitting overbought conditions, though it is approaching a level where caution may be warranted.
💡
Catch the live event with Casey Stubbs—save your spot now! Learn The Way Here:
Key Observations:
- The market is in a strong bullish phase, but it's approaching a significant resistance level at 5671.7.
- The RSI is in a healthy position, but traders should watch for any bearish divergence or a move towards overbought levels, which could signal a potential reversal or consolidation.
- The ascending trendline provides a solid support base, and as long as the price stays above this line, the uptrend remains intact.
Conclusion:
The S&P 500 is currently bullish, with potential to test the resistance level at 5671.7. However, traders should be cautious as the price nears this key resistance and monitor the RSI for any signs of weakening momentum.
To Your Trading Success,
Casey Stubbs
💡
Sign up today to unlock the secrets of election year profits! Learn The Way Here:
Keep this development on your radar as we may see increased volatility and potential trading opportunities in the near future.
💡
Get my book to learn the exact methods I trade. The Complete Trading System
